Case Study Background :
The Sales Reports contains elements of sales data, such as Daily, Weekly and Month-to-Date Sales numbers, characterized by various organization units, customer groups or Product groups or hierarchies. They are important for all departments within the organization for their standard control activities. In its final form it is most likely to be an email containing a simple summary of a KPI spreadsheet, sent to anybody that has an interest, including Operational, Tactical and Strategic management. It also contains the benchmarks for the business, the numbers that operate as the final check on success or failure of the business. And if done properly it should provide a focus, a challenge, an incentive and a way to motivate.
- Industry : Manufacturing
- Department : Finance
- Report : Daily/Weekly/ MTD Sales Reports, lay comparison between actual and corresponding Budget, Forecast and Prior year figures for various time periods, org unit, product or customer hierarchies. Comparatives used are: Sales Volume, Net Sales Value, and Cost Of Goods, Discounts, Rebates, and Gross-Margin etc.
AS-IS:
- Finance department downloads sales volume, master data, standard price information from the ERP system manually and maintains them as separate excel worksheet.
- Finance department prepares the budget/forecast data using the actual information they have collected from ERP system and these are maintained in the same excel document as the other data types collected from ERP system.
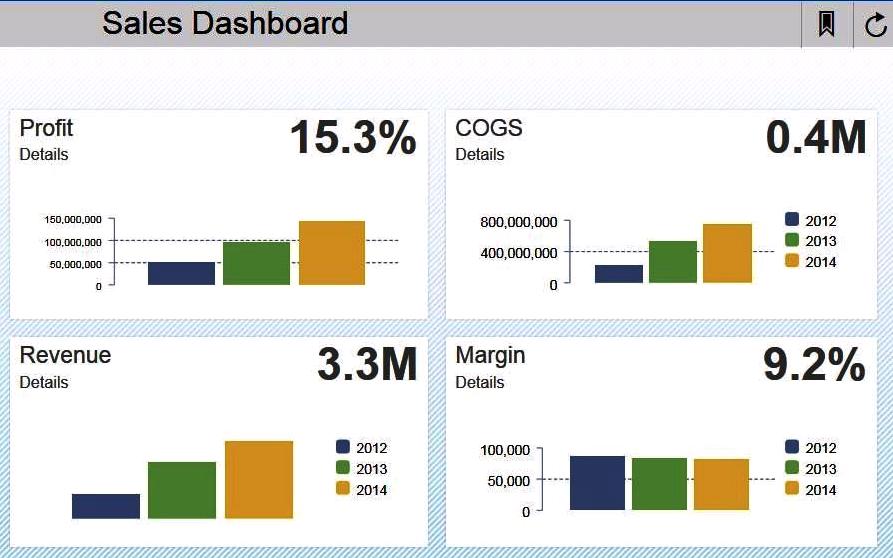
- Using cell reference feature of native excel, a sales report is prepared which displays, how the gross margin figure is calculated from the revenue figure by various time periods such as daily, weekly and MTD (Month-to-date)
TO-BE :
- Actual volume sold need to be picked up from SD line item, after post goods issue postings.
- Budget & Forecast data needed to be provided by finance department and the same need to be integrated/ compared with actual data.
- Different types of discounts and rebated needed to be held and deducted from sales (sales volume * standard price) amount.
- Currency translation and Single unit translation needed to be performed on Sales and Volume figures respectively.
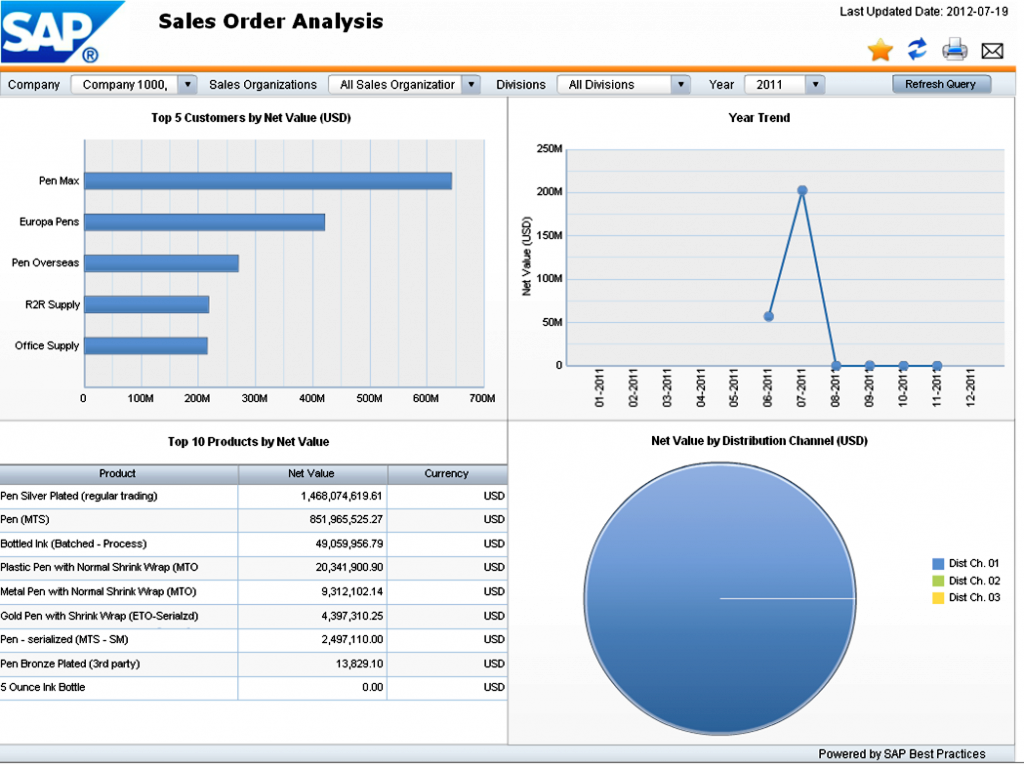
- Formatted crystal reports were requested for daily report broadcasting via email. Interactive reports using SAP BO Analysis for Excel were requested for performing slice & dice analysis. Interactive report can drill down to customer and material level if needed.
- Report needed to display all components of income statement (Statement of Comprehensive Income), starting from revenue up to gross margin.
At CPI; we are known for our strong views and value driven approach. Some times inspired, sometimes contrarian and – of course – sometimes wrong but always well researched and always our own. We are respected by our clientele for our uniqueness.
Our value focused approach does not suit every situation but in our experience more and more clients are looking for an accountable, performance focused approach and a partner who can invest alongside their clients. We are benefiting from this trend and we hope to make our approach familiar to all our customers and potential customers.